Ontogeny of Locomotor Function

Ontogeny of Locomotor Function

The ontogeny of fish locomotion is one focus of research in our laboratory, and a number of our recent papers address the ontogeny of locomotor function in zebrafish. See McHenry and Lauder (20052006) and Danos and Lauder (2007).

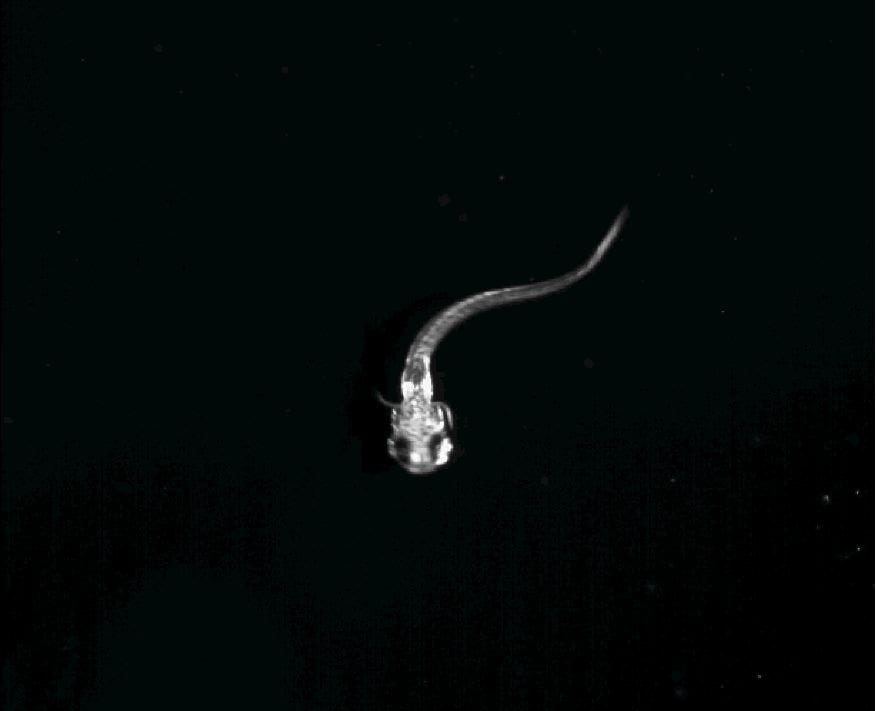
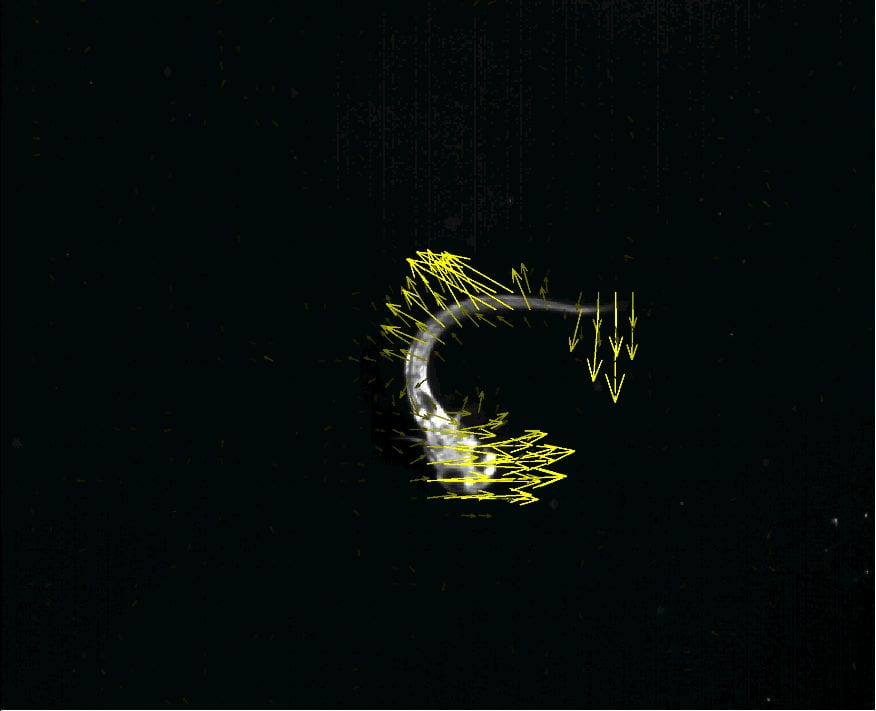
We use high-speed video to quantify motion of the body and fins throughout development in zebrafish, and have developed an image-correlation approach to analyzing body and fin kinematics. See Lauder and Madden (2008) and Danos and Lauder (2007). Both coasting behavior as well as routine turns have been studied, as well as research involving manipulations of the viscosity in which developing zebrafish swim.

Larval zebrafish initiating a routine turn. Frame from high-speed video (1000 fps) of routine turning in zebrafish. See Danos and Lauder (2007).
Larval zebrafish during a routine turn to show the results from image cross-correlation wherein the motion of the entire body is cross-correlated between adjacent frames to reveal the velocities of motion on different parts of the body. Yellow vectors show the velocity of the region of the body at the base of the vector. Frame from high-speed video (1000 fps) of routine turning in zebrafish. See Danos and Lauder (2007).
Larval zebrafish during a routine turn to show the results from image cross-correlation wherein the motion of the entire body is cross-correlated between adjacent frames to reveal the velocities of motion on different parts of the body. Yellow vectors show the velocity of the region of the body at the base of the vector. Frame from high-speed video (1000 fps) of routine turning in zebrafish. See Danos and Lauder (2007).
Pattern of ontogenetic change in three kinematic variables during development in zebrafish See Danos and Lauder (2007).
Reynolds numbers (Re) spanned during coasting by zebrafish of different size. (A) Dorsal and lateral silhouettes illustrate the shape of the body (grey) and fins (black) at different stages of growth. (B) The range of Re traversed during coasting in fish of different size. The upper and lower edges of vertical bars and error flags denote, respectively, the mean and 1 S.D. of maximum and minimum values (as shown in key) for three coasts per fish (N=22). Stages of growth are color coded for small larvae (orange), large larvae (blue), juveniles (purple) and adults (green). The hydrodynamic regimes (broken lines) from drag measurements are shown to the right. (See McHenry and Lauder, 2005).
Reynolds numbers (Re) spanned during coasting by zebrafish of different size. (A) Dorsal and lateral silhouettes illustrate the shape of the body (grey) and fins (black) at different stages of growth. (B) The range of Re traversed during coasting in fish of different size. The upper and lower edges of vertical bars and error flags denote, respectively, the mean and 1 S.D. of maximum and minimum values (as shown in key) for three coasts per fish (N=22). Stages of growth are color coded for small larvae (orange), large larvae (blue), juveniles (purple) and adults (green). The hydrodynamic regimes (broken lines) from drag measurements are shown to the right. See McHenry and Lauder (2005) .